Comparison of Evolutionary Algorithms on a
Benchmark Function Set
The Task. Black-box optimization of 25 benchmark functions
under thoroughly defined experimental and recording conditions for the
2005 IEEE Congress on Evolutionary Computation: Session on
Real-Parameter Optimization (see resources links
below). 17 papers were submitted, 11 were accepted, thereunder
hybrid methods.
Algorithms.
We submitted two
algorithms.
L-CMA-ES (Auger and
Hansen 2005b): A CMA evolution strategy with small population size and
small initial step-size to emphasize on local search
characteristics. Independent restarts are conducted until the target
function value is reached or the maximum number of function
evaluations is exceeded.
G-CMA-ES (Auger and Hansen
2005a): A CMA evolution strategy restarted with increasing
population size (IPOP). Independent restarts are conducted with
increasing population size until the target function value is reached
or the maximum number of function evaluations is exceeded. With the
initial small population size the algorithm converges fast, with
the succeeding larger population sizes the global search performance is
emphasized in subsequent restarts.
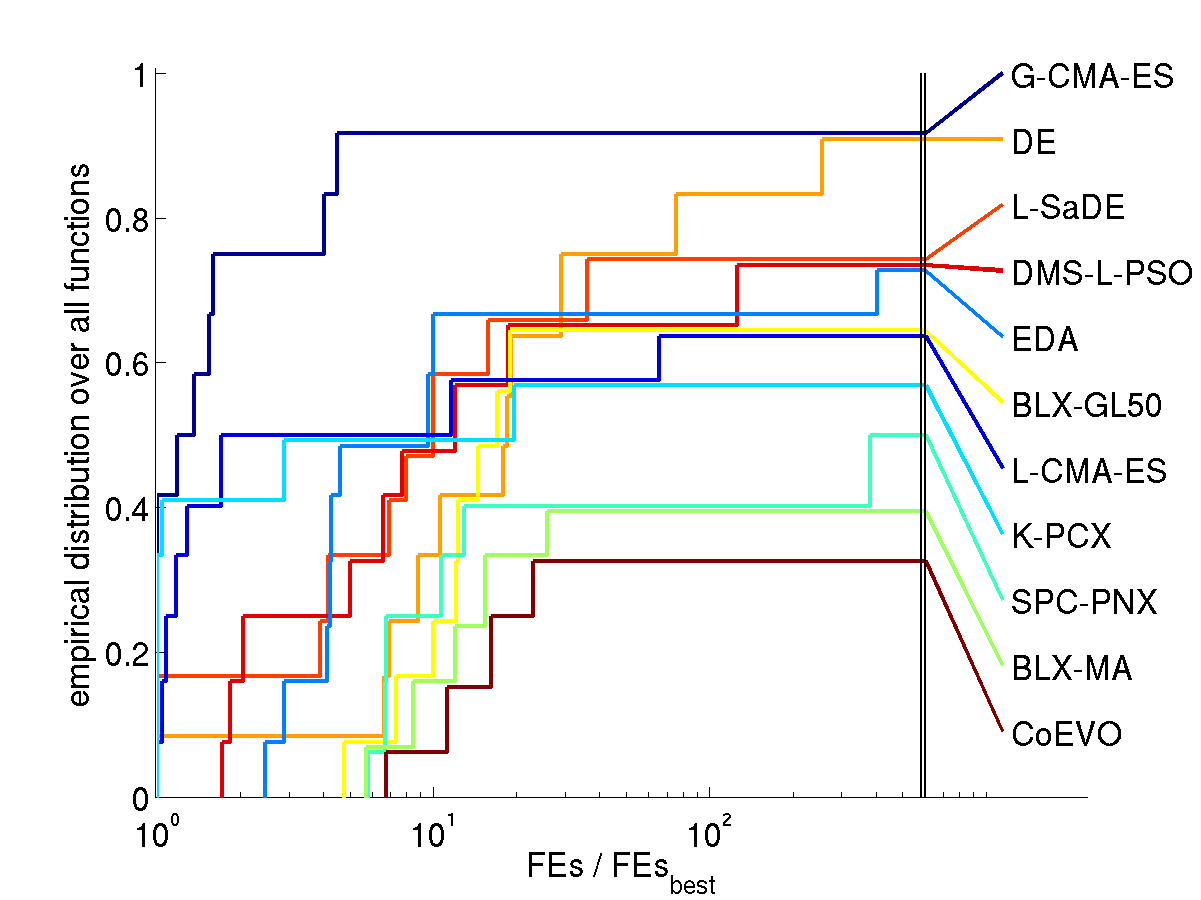
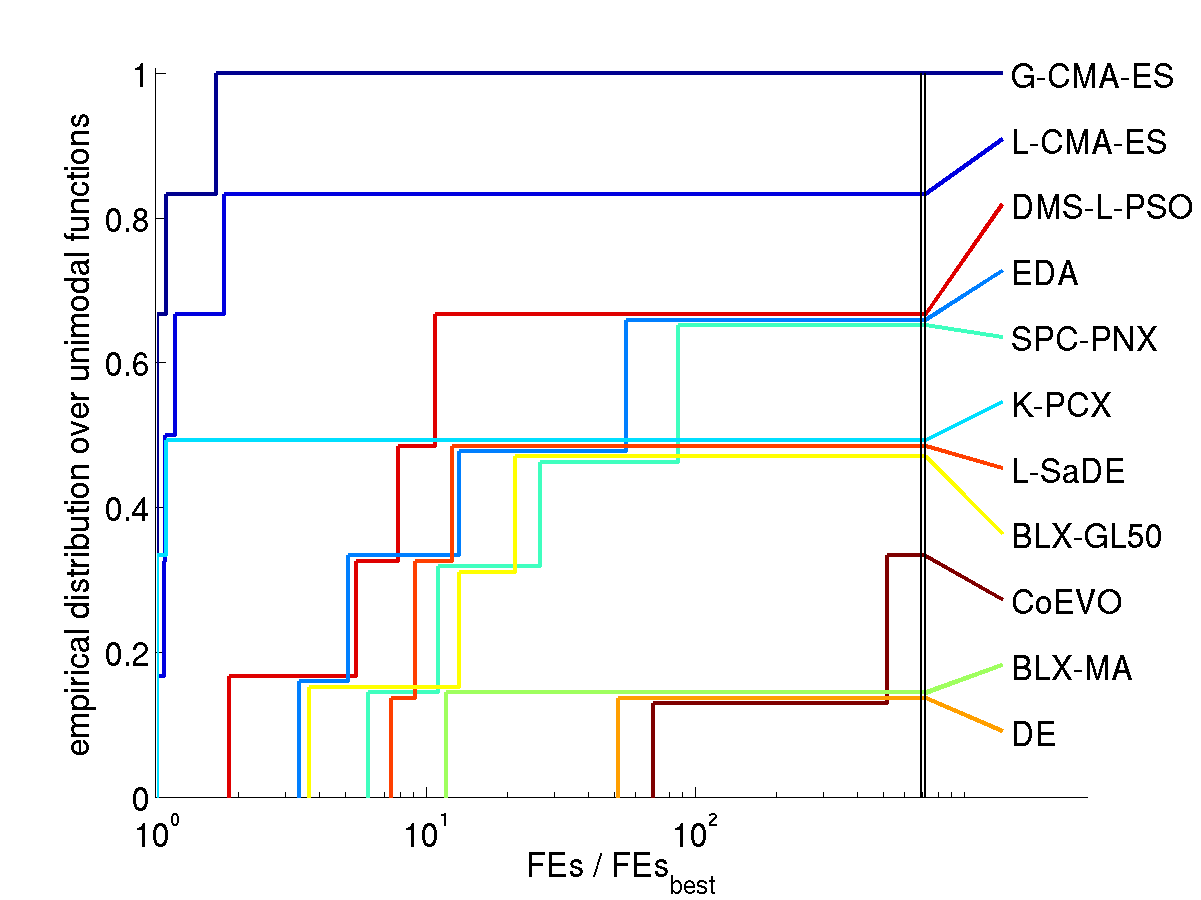
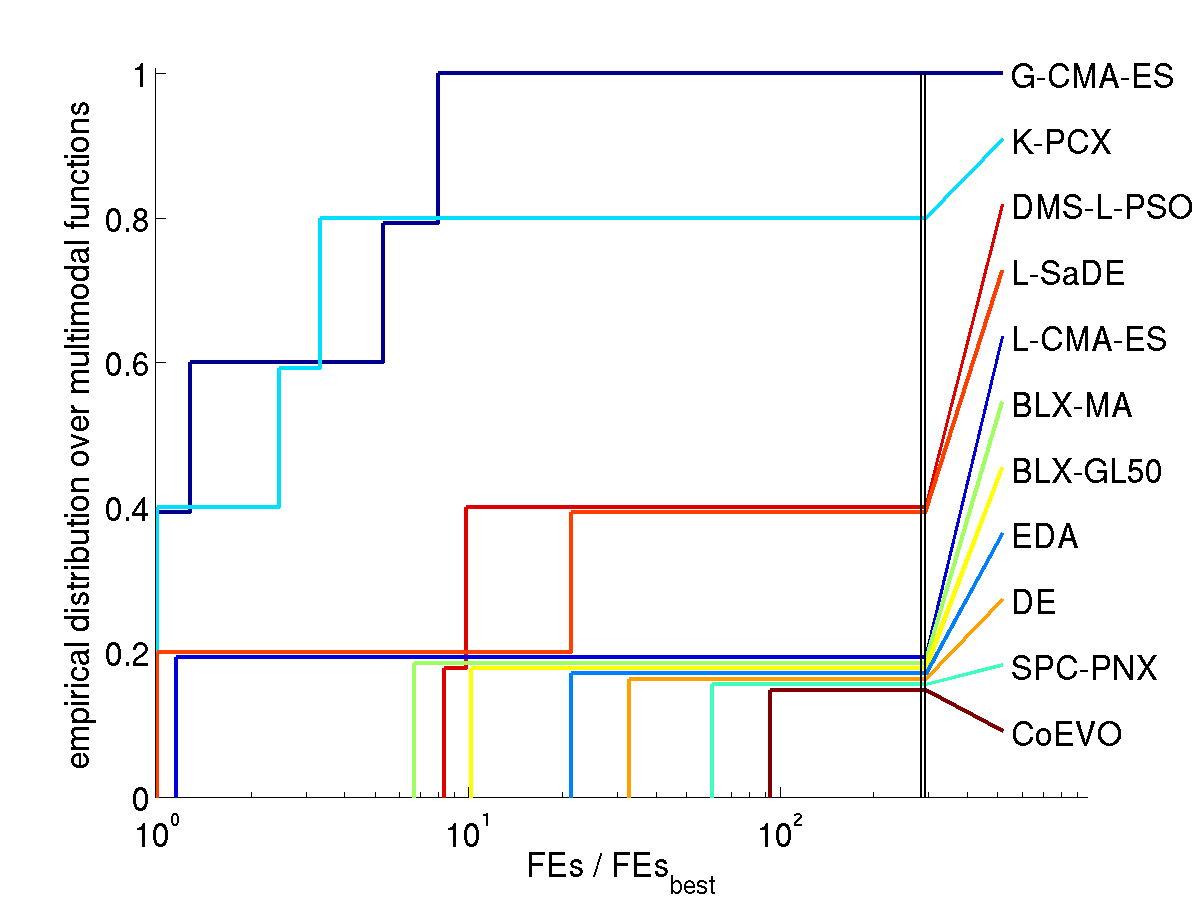
Results. The following figures show the comparison of
performance results from the 11 algorithms for search space dimension
10 and 30 on different function subsets. The expected number of
function evaluations to reach the target function value is denoted
with FEs (equivalent to the performance measure SP1 in Auger and Hansen 2005b) and normalized
by the value of the best algorithm on the respective function,
FEsbest. Shown is, for each algorithm, the empirical
cumulative distribution function of FEs / FEsbest over
different sets of functions in 10 and 30D. Small values for FEs /
FEsbest and therefore large values of the graphs (the
cumulative distribution function) are preferable.
All functions solved by at least one algorithm
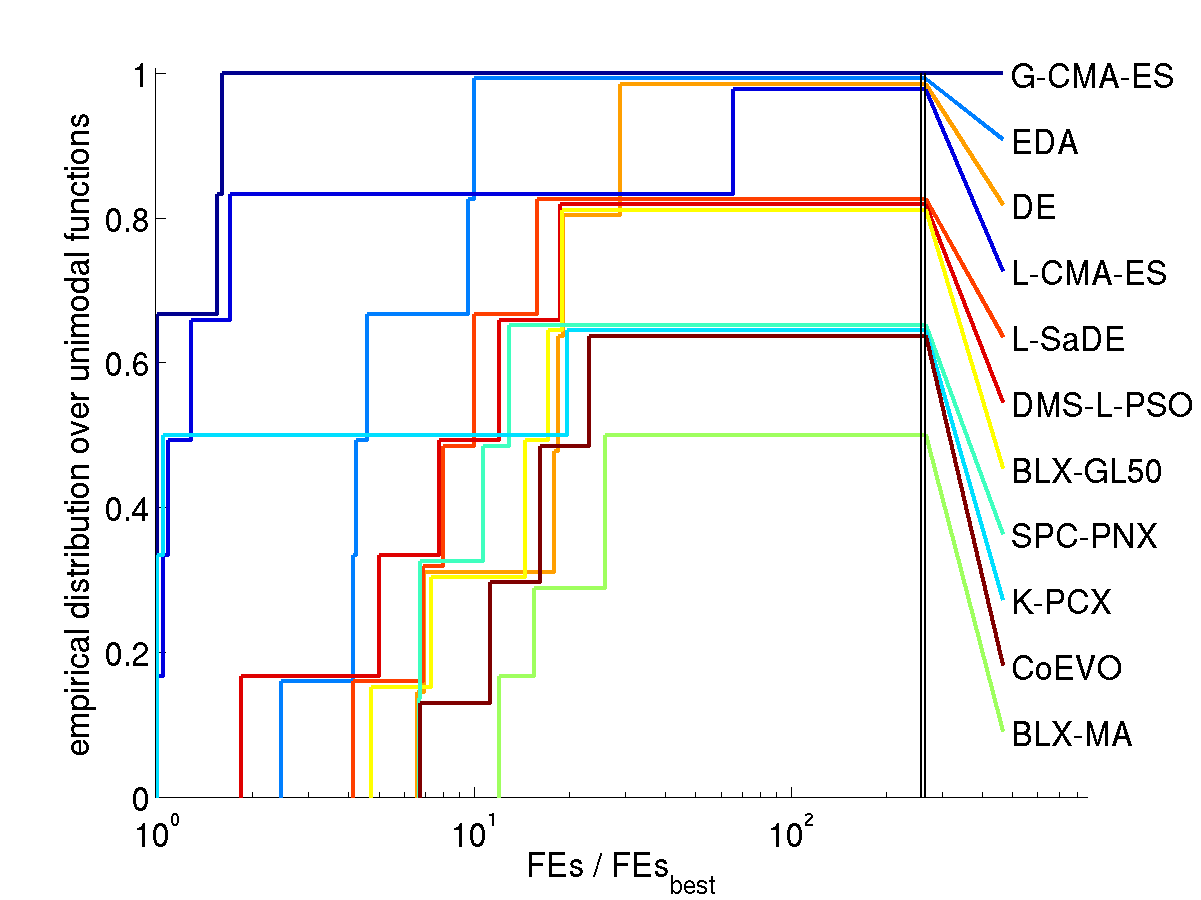
Unimodal functions
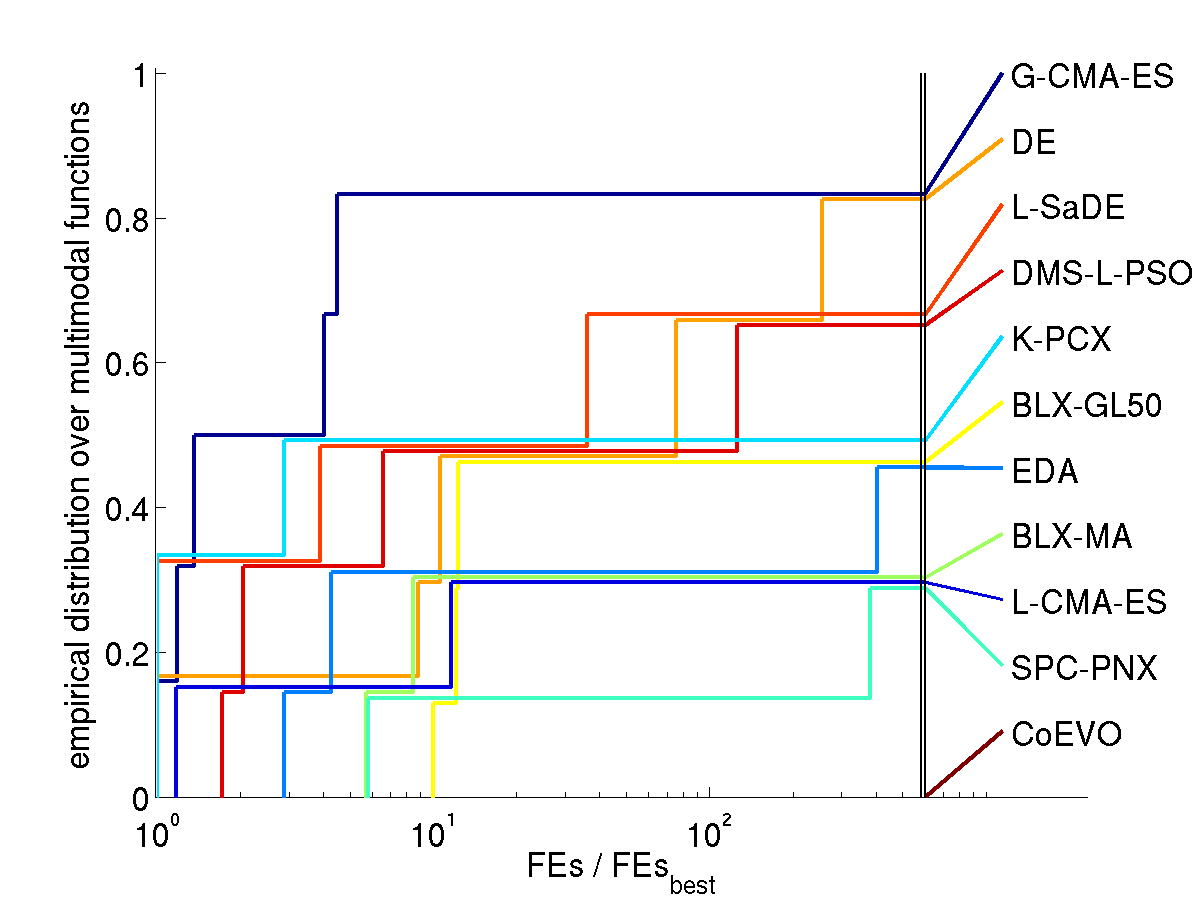
Multimodal functions
10D
30D
The algorithms are referenced in the comparison of results in the Resources section below.
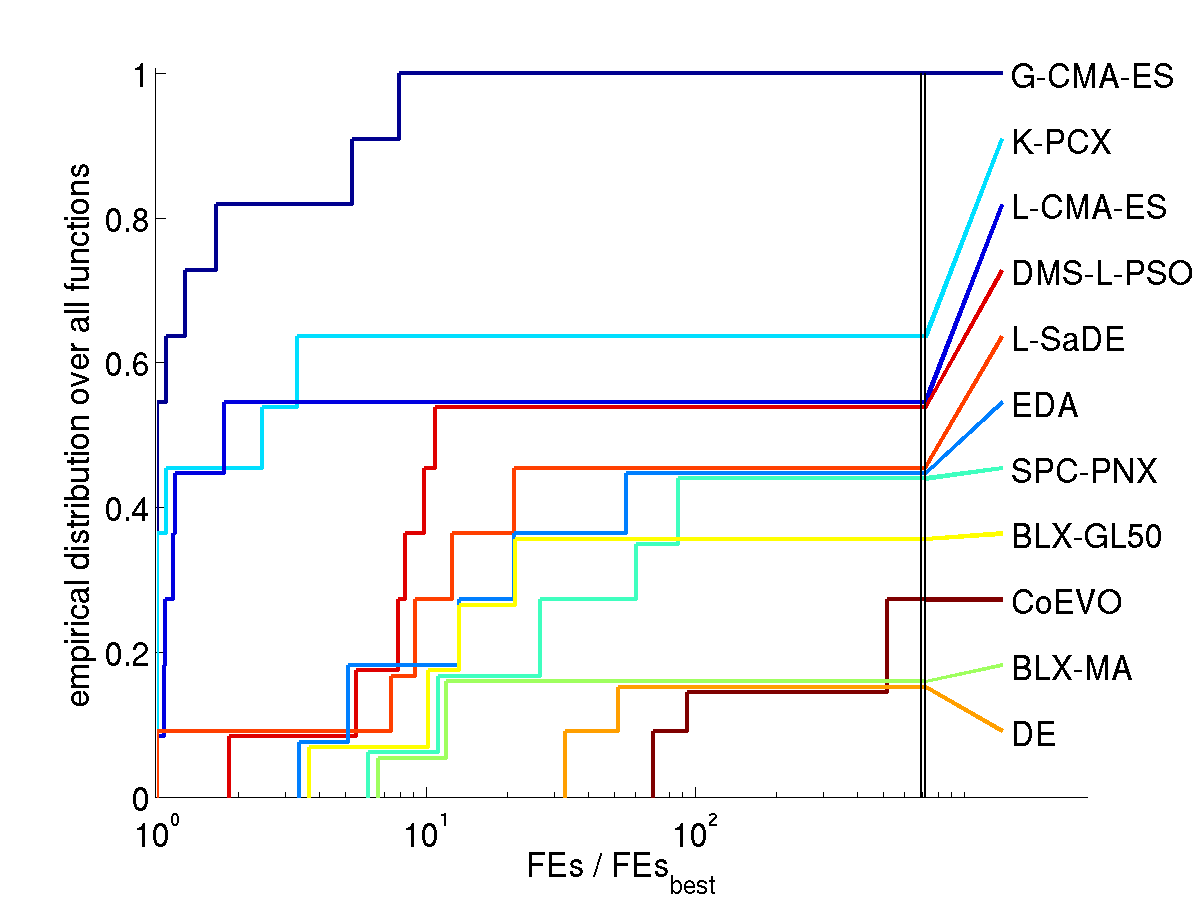
How to read the graphs. In the lower left figure (all
solved functions in 30D) we find for FEs / FEsbest = 2
(x-axis) a value of about 0.82 (y-axis) for the graph of G-CMA-ES
(uppermost graph). That means, on 82% of the functions G-CMA-ES was
at most 2 times slower than the best algorithm (in terms of expected
number of function evaluations). For FEs / FEsbest = 10 we
find a value of 1 in the distribution graph, meaning that G-CMA-ES was
maximum 10 times slower on all of the functions. The right most values
of the graphs give the ratio of ever solved functions, ranging here
between 100% for G-CMA-ES and just under 20% for BLX-MA and DE (due to
the comparatively low number of overall allowed function evaluations).
Discussion. Compared to all contributed algorithms the G-CMA-ES
appears to be advantageous from three perspectives.
The G-CMA-ES performes best in terms of number of function
evaluations to reach the target function value
over all solved functions (left figures)
on the subset of unimodal functions (middle figures)
on the subset of solved multimodal functions (right figures)
The G-CMA-ES performes best, in terms of ranking of the final function
value, on the remaining subset of functions, where no algorithm
reached the target function value in any trial (see comparison of
results in the Resources section below).
On two separable functions the CMA-ES is considerably outperformed by
other contributed algorithms.
No parameter tuning is conducted for the CMA-ES which appears to be true also
for L-SaDE, BLX-MA, DMS-L-PSO, BLX-GL50, and CoEVO. The default
parameter values were applied for CMA-ES.
Interpretation. Hypothetical explanations for the performance advantage
of the CMA-ES are the following (still valid in June 2011).
On unimodal functions:
The population size is small in the beginning.
The population can get an (arbitrarily) elongated shape along any
direction in search space without collapsing
into a lower dimensional subspace even for small population size.
Step-size control effectively prevents premature convergence
and allows for fast convergence to an optimum. This is not a
contradiction in terms.
On multi-modal functions the population spread is decisive.
Even for a small population size the population spread is
comparatively large, due to the cumulative step-size adaptation (path
length control), and hinders convergence to the very closest local
optimum.
Larger population sizes are used after each restart. The larger
population sizes can facilitate a larger population spread for longer
time periods and therefore a "more global" search. Here, the covariance
matrix update facilitates a comparatively large population spread.
Remarks.
The CMA-ES was the only non-elitistic algorithm in the competition.
There has been an inconsistency with the boundary handling in the experimental setup, which is, at least in part, now documented in the respective batch files. On some functions, boundary handling has a significant impact on the performance.
The used Matlab code in this
comparison study, used within this
batch file (increasing population size, IPOP-CMA-ES, G-CMA-ES)
and this batch file (local
search with constant small population size and small initial step-size,
LS-CMA-ES, L-CMA-ES)
All results, data, figures and source code (tar.gz 18MB)